Market Research Tracker: Data Strategy best practices x BrandTrends

Matthieu SAUSSAYE
5 min read

Market Research - Data Strategy : Tracker Best Practices
From a smartinteview Use Case: tracking 1000s brands in 40 countries
Brand tracking is a critical data collection process for brands, allowing companies to gain insights into brand performance across multiple regions and brands. However, managing data across +1000s of brands in 40 countries can quickly become overwhelming on a data point of view.
The key to success in this space lies in having both the right data strategy and the right technical expertise.

Brand tracking is a powerful method for scaling the number of end-customers for a Market Research institute, but it has to be done correctly. But they could face many challenges such as not having the right delivery process for survey data to analytics.
In order to do it right, they need both the right engineers and the right strategy.
We recognized the potential of a more robust solution that would help market researchers track brands across diverse geographies and automatically analyse enhanced quant/qual insights.
End-clients are big entertainement firms.
We found that combining advanced AI models—such as speech-to-text technology—and Large Language Models (LLMs) dramatically increase the insight quality for brand research insights.
Moreover, scaling a Brand Tracker to a "SaaS/product" version would allow the team to save a large amount of time by reducing manual work.

Team gathering in Dubai, 2025.03
(from left to right: Paul Serre, Full-stack Freelancer working on smartinterview, Nicolae, Software Engineer at Pulse Partners and I)
But this was not easy… we made plenty of mistakes early on while trying to align SmartInterview with this final tracker. In this article, I’d like to share our biggest lessons learned after many failed attempts to create the most powerful brand tracking market research software by integrating smartinterview.ai.
Challenges
Initially, I realized that one of the biggest challenges for market researchers lies in their IT and data strategy. This area is often outside their expertise, making it difficult to allocate the right resources—both time and money.
Choosing the right partners to ensure that their data strategy aligns with their core activities can be a daunting task. Moreover, relying on off-the-shelf market software can become prohibitively expensive, with costs easily reaching $100K per year for small institutes.
We then developed an initial PoC to prioritize this type of research in our initial ICP.
It is quite complex but we knew that by solving this king of tracker we could solve all easier use cases.
Then, our main proposition was to significantly improve the quality of insights for Market Research Institutes customers by using LLMs models and Speech-to-text inside their open-ended question. We had then to consider the critical industry standards, which essentially were our “market entry barriers.”
An excellent Quantitative Market Research data collection software, from a data perspective, should be built on two key pillars:
Data Delivery
Timing Data Quality (no fake data, no missing data, etc.)
Except if you're really strong in understanding and defining early requirements and reverse-engineering the most successful software on the market, I believe any Market Research software builder should face the difficulties we encountered and nearly fail some projects early on.Here’s a breakdown of these pillars: how we struggled with and ultimately solved these specific challenges inside SmartInterview.
1. Data delivery timing:
We previously described the response of multi-choices questions with these specific ids:
response_table:
id[int] | value | list[str]
id as a the name of the question
value the response
list_str the list of items for multi-choice.
However, this made it difficult to manage multi-choice questions across multiple surveys.
At the beginning, SmartInterview was slowing down most of our customers, despite providing deeper insights, which made it unreliable in terms of cost-effectiveness
Data quality

Smartinterview question
In this article, we’ll also explain how we addressed challenges to meet industry data quality standards, which ultimately allowed us to deliver more projects with better insights than our competitors.
We had to double down on our focus on both data quality and speed standards to transform SmartInterview into a professional Market Research software solution.
Data quality essential means:
No loss of data inside a survey
Rich insights (speeder removals,…)
Logic fieldwork management across samples
Solutions
Data delivery timing:
For multiple countries, we adapted the data format, enabling customers to aggregate data from 17 countries with a single SQL query. The quantitative market research data is now automatically aggregated, making it easier to build analytics on top of it.We achieved this by re-indexing the entire software and adding an additional layer for each customer’s response.
—> We had to transform the data output format.
We changed, for example, the multi-choice to:
(new) response_table:
id[int] | ID[str] | value | dict[int : str]
The ID corresponds to the question ID, and the value corresponds to the response. Mapping these with keys allows us to group data from multiple surveys.
It may seem simple, but when the entire software relies on this structure, it takes weeks to make the necessary changes.
Previously, with the old data architecture, we had to execute one SQL query per country (500+ rows), like this extract for Spain:

Smartinterview - ancienne query SQL
and now it gets more easier, so we could scale and aggregate 40 countries in one query:
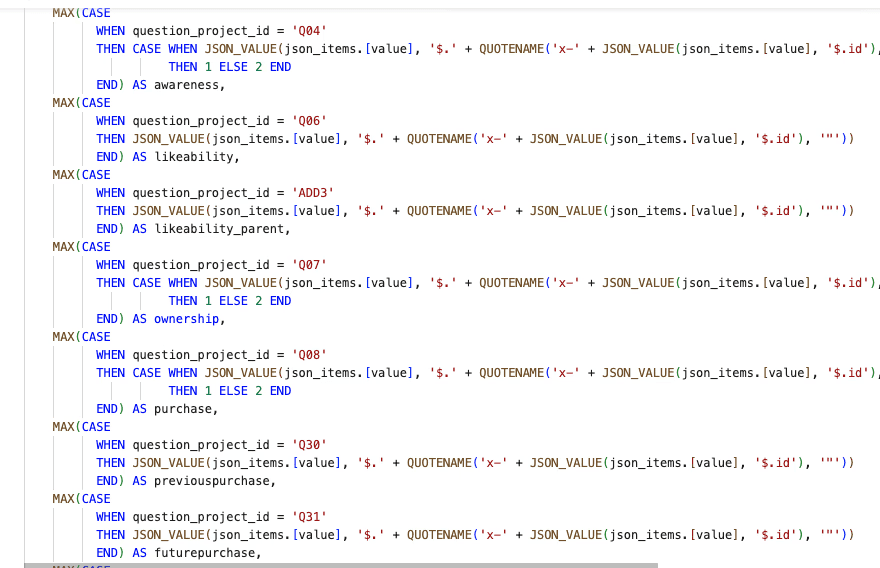
Smartinterview - nouvelle query SQL
Customers can now easily aggregate survey data to build analytics on top of it.
We concluded that in this industry, we must prioritize integration from the very beginning of each project to ensure every customer maximizes the value of our solution. They should experience equal or better delivery times for each project, paired with excellent qualitative insights.
This detail may seem mundane (SQL queries of 500+ lines), but it's crucial to scaling our solution.We’ve been amazed at how a necessary data transformation step can ultimately lead to time loss if not addressed early on.If you’re facing a similar use case, make sure to anticipate integration from the start.
I made a full video explaining how to manage internal data strategy for successful AI integration: YouTube link
If you understand French, I’m sure it will be useful to ensure you anticipate integration.
Data quality :
We accelerated the feedback loop between responses and analysis by deploying a comprehensive analytics dashboard for both end-customers and us as programmers.By reverse-engineering industry standards, we implemented:
% Drop-out measure
% Completed measure
Completion boolean per respondent
And other key parameters commonly used in Market Research software.
Now, you can track the most important Market Research KPIs through our proprietary dashboard (app.smartinterview.ai):

smartinterview exclusive B2B analytics dashboard
The right data strategy - a summary
An automated survey data delivery into powerBI analytics was made possible using the following architecture:
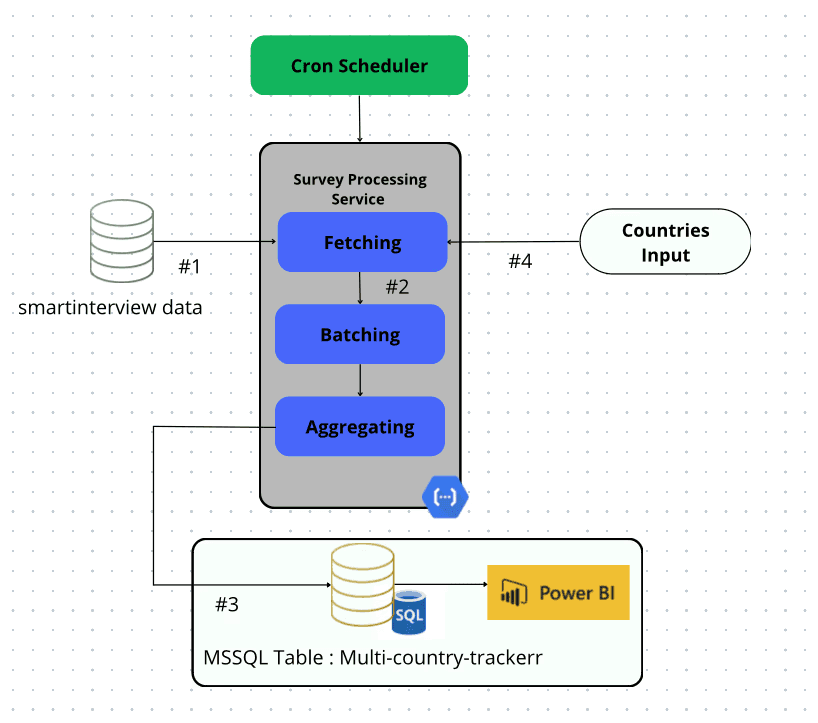
smartinterview exclusive B2B service for trackers
The cloud function extracts, aggregates, and imports data from SmartInterview into Azure SQL for the end customer who needs access to live data.
Every 5 minutes, we upsert data from the past 24 hours. This approach drastically reduces the time between data collection and insight presentation, especially compared to the traditional PowerPoint reports commonly used in Market Research Institutes.
As a result, the customer reported saving 20 full-time equivalent (FTE) days per quarter.Furthermore, confronting this initial challenge helped us determine the ideal data format for SmartInterview’s output. While it initially delayed our go-to-market process, it was for a crucial reason: we were building a robust data architecture that not only meets but can exceed industry standards—particularly for brand trackers when businesses rely on our infrastructure.
Through discussions with Market Research leaders, we realized that many AI solutions on the market don’t undergo this challenging data transformation process, making them less suitable for market research projects.
qAI Optimization
One of the key areas of AI adoption is in analyzing open-ended questions within SmartInterview. We experiment it with a complete new approach to detect and enhance brand recognition, concept testing in open-ended questions during brand tracking.
But we'll dive deeper into this topic in the next article 😌, so stay tuned!
The evolution of Market Research trackers
To open on other interesting subjects:We’ve identified untapped potential in Market Research trackers, where AI and large-scale data engineering could significantly increase value for end clients.Here are 3 major trends we’re currently tackling and will describe soon:
1. AI Explainability
Justifying an insight by connecting it directly to a specific respondent.
2. A New Data Layer for Unstructured Data
This layer bridges unstructured data from open-ended questions with conditions using LLM-StructuredOutput. This is a game-changer as it allows us to navigate and quantify unstructured insights, enabling analytics without the need for thousands of hours of manual work afterward.
3. AI Classification
Detecting sentiments and identifying “golden” or “fundamental” topics. This has immense value for Market Research institutes, as it saves them days of work when scaling their analysis of open-ended responses.
Through our partnerships with OpenAI and Microsoft Azure, we also get early access to new models to experiment with and integrate into our products.If this excites you and you’re facing similar challenges, feel free to reach out to me at matthieu.saussaye@pulse-partners.ch.
We’re always on the lookout for innovative companies aiming to scale their data insights strategy, as well as smart engineers to join our team!

